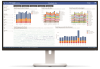
AeroRemote Insights builds on the best service response program in the industry with a brand new productivity dashboard - providing system and technologist usage visualizations - that deliver a whole new level of value.
The system collects and aggregates valuable data daily such as exam volume, rejected image reasons, and exposure levels for exams. This data is automatically integrated into easy to interpret visualizations that are useful for productivity assessment, identification of training opportunities, and asset management.
Capitalizing on the electronic drop sensors of AeroDR[1], AeroRemote detects and transmits incidents of minor and major drops. Instant email alerts communicate major drops that could be damaging to the panel and the CS-7 prompts users to perform a quick diagnostic check. The email notifications inform managers and the Konica Minolta call center about the failure so that they may begin preparing for the appropriate response.

Evaluate Personnel Performance
Evaluate Personnel Performance from a variety of metrics to assess user accuracy, productivity, and exam exposure level patterns. Easy to view graphs to make sense of complex data.
Maximize System Utilization
Maximize System Utilization by analyzing usage trends. At a glance, gain deeper understanding of how, when, and by whom systems are being used.
Minimize Service interruptions
Minimize Service interruptions with immediate response to critical events (such as panel drops) that get the right people responding instantly. Stay on top of maintenance needs and service contracts with a simple click.
Automated Panel Drop Detection, Diagnosis, And Replacement

With AeroRemote®, you’ll receive a real-time email notification when an AeroDR® panel is dropped or bumped. Users are prompted by the CS-7 or Ultra Control Station to run a panel check tool that gives an immediate result.
If the panel is damaged, a replacement can be delivered via same-day or overnight shipping. Even installation is fast and easy. Simply insert the replacement AeroDR® panel into the docking station, select the Quick Replacement option, and follow the instructions. In a matter of minutes, you’ll be ready for your next patient.
At a glance views of valuable data, such as:
- # of exams performed
- Rejected image rates
- Rejected image reasons
- Exposure index information
- (S-value, EI/DI)
- Dropped panels, calibration schedules, and other system data
- Windows OS and application software versions
View this data by:
- Location (e.g. Room 1, Portable 1, ED, etc.)
- Time
- Technologist
- Exam type
Technical details
- Web-based analytics dashboard
- Data collection: Requires CS-7 Version 1.35 or later or Ultra Version 4.3.2 or later with outbound internet connection
- Dashboard viewing: Use with any web browser. App available for iOS or Android devices.
- No PHI to worry about